Warning For a better experience on CFAL,  update your browser.
CFAL notify@nmailtwo.com +1 (242) 502-7010 Website related description
The Bahamas P.O.Box CB-12407 Nassau New Providence The Bahamas The Bahamas
CBFL

CFAL Balanced Fund Ltd.

Fund Inception Date
Oct 31 1994
NAV/ share
$5.345
Risk Level
Moderate
Total Net Assets
$33.651M
Q2 2024 Return
2024 YTD Return
2023 Return
  • Investment Objective: CFAL Balanced Fund, Ltd. (“the Fund”) seeks to achieve diversified above-average risk adjusted returns consistent with the Fund’s risk tolerance.
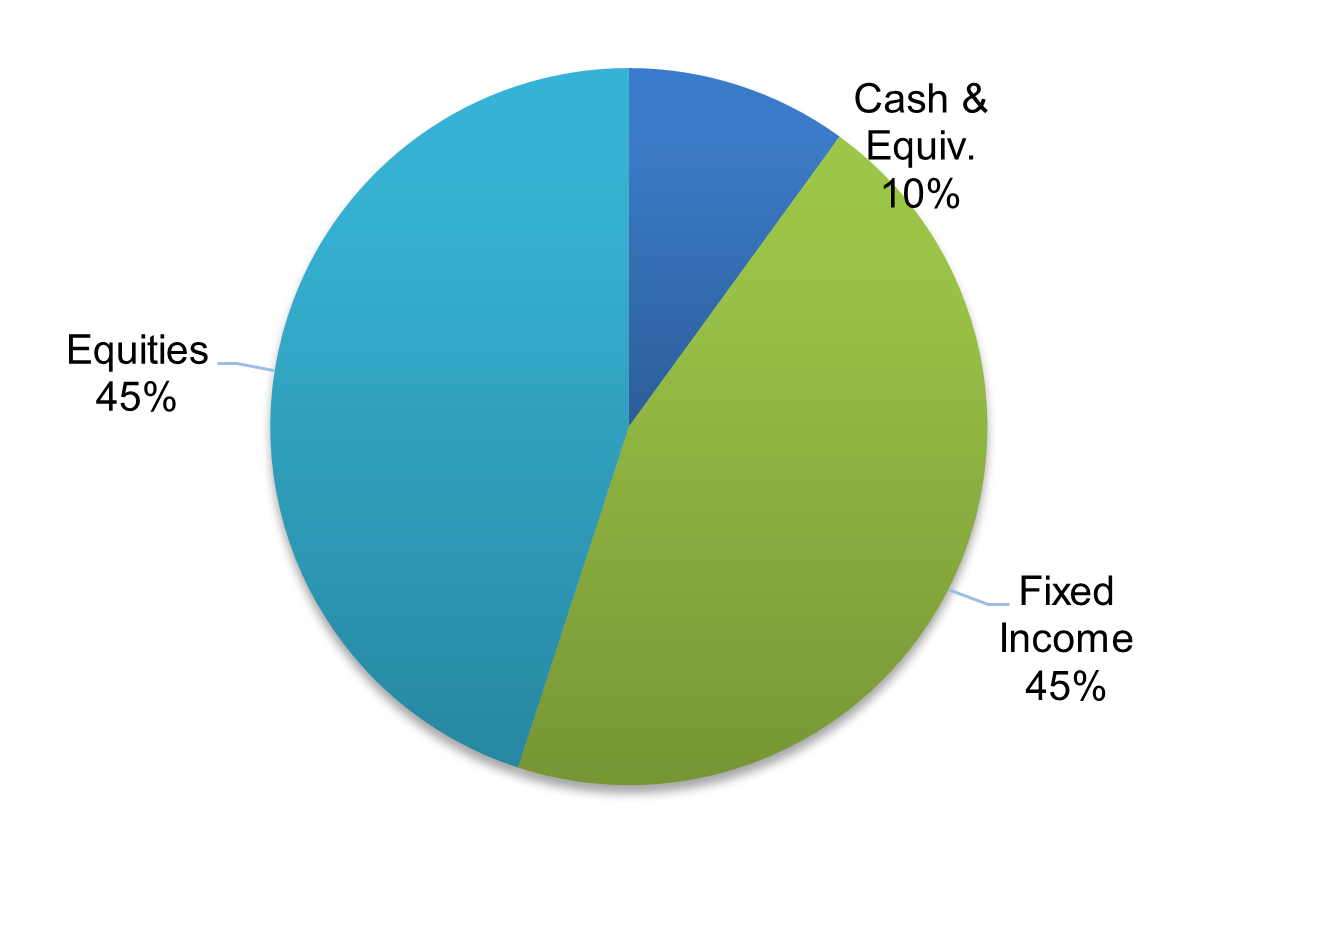
  • Investment Strategy: The Fund will pursue its objective by investing primarily in a blend of equities which possess strong long-term value and growth and high-quality fixed income securities. These investments may include common stock, preference shares corporate and government bonds and cash equivalents.
  • Fund Suitability: This strategy is for long-term investors who seek the highest total return (income & capital appreciation).
KEY FACTS

Size of Fund (June 2024)

$33.651M Distribution Frequency Monthly
Inception Date October 31 1994 Minimum Initial Subscription $1,000.00

NAV Per Share (June 2024)

$5.345 Minimum Additional Subscription $100.00
Benchmark    Blended Index (BISX/Local Prime Rate/Weighted Avg. Deposits) Management Fees 1.00% p.a.
Asset Class Fixed Income & Equities Subscription/ redemption fees 0.00%
Risk Level Moderate Expense Ratio (2023) 1.04%
Currency    BSD Early Withdrawal Fee No early withdrawals permitted

Current Asset Allocation


EQUITY SECTOR ALLOCATION
Sector (%)
Financials 67.25
Energy 21.39
Consumer Staples 6.58
Utilities 2.14
Industrials 1.69
Consumer Discretionary 0.91
Health Care 0.04

Target Asset Allocation


TOP 5 COMMON STOCK HOLDINGS
Holdings (%)

2024 YTD Return (%)

Focol Holdings 4.60 +9.93
Colina Holdings 3.36 +12.12
Commonwealth Bank 3.25 -2.95
J.S. Johnson 3.12 +9.32
CIBC FirstCaribbean (Bah) 2.16 +8.93

Returns

as of
  QTR2 YTD
Fund (%) +0.71 +2.77
Benchmark (%) +0.59 +2.58
+/- Benchmark (%) +0.12 +0.19


GROWTH OF $10,000

Disclaimer: The performance quoted represents past performance and does not guarantee future results. Investment return and principal value of an investment will fluctuate so that an investor’s shares, when sold or redeemed, may be worth more or less than the original cost. Current performance may be lower or higher than the performance quoted.


as of
  1 Year 3 Year 5 Year 7 Year 10 Year Incept.
Fund (%) +6.82 +6.17 +4.48 +4.41 +4.62 +5.81
Benchmark (%) +9.38 +9.06 +5.21 +5.40 +5.36 n/a
+/- Benchmark (%) -2.56 -2.89 -0.73 -0.99 -0.74 n/a


Returns longer than 1 year are annualized

GROWTH OF $10,000

Disclaimer: The performance quoted represents past performance and does not guarantee future results. Investment return and principal value of an investment will fluctuate so that an investor’s shares, when sold or redeemed, may be worth more or less than the original cost. Current performance may be lower or higher than the performance quoted.


as of
  2024
YTD
2023 2022 2021 2020 2019 2018 2017
Fund (%) +2.77 +6.18 +4.87 +5.32 +1.58 +2.93 +2.49 +5.68
Benchmark (%) +2.58 +5.97 +11.18 +5.28 -1.28 +4.88 +3.20 +6.59
+/- Benchmark (%) +0.19 +0.21 -6.31 +0.04 +2.86 -1.95 -0.71 -0.91


GROWTH OF $10,000

Disclaimer: The performance quoted represents past performance and does not guarantee future results. Investment return and principal value of an investment will fluctuate so that an investor’s shares, when sold or redeemed, may be worth more or less than the original cost. Current performance may be lower or higher than the performance quoted.